Because Audubon Woods is only 4 miles from the school, it is a convenient off-site location for teaching Winn students about forests and forestry. This week marked the sixth year that Winn students have participated in this activity - I looked back on my old work calendars (which I save for just this reason) to make sure. Sometimes the students visit in the fall and spring; this school year we were only able to schedule a spring visit.
Audubon Woods is a roughly square (40 acre) parcel along the south bank of the Chippewa River. The preserve is completely covered with mature forest; Beech/Sugar Maple Forest in its upper parts and transitioning to Floodplain Forest near the Chippewa River. The woods makes a great outdoor learning laboratory.
The following write-up pertains only to the 5th Grade students. Students in 3rd and 4th Grade performed modified versions of the same activities.
One of the activities that I prepared for students involved measuring and mapping trees. I set up 15 fixed points in the woods, indicated by numbered markers. The class was divided up into five groups with each group being responsible for three stations (plots). At each station the students were required to identify every tree over 6 inches diameter at breast height (DBH) that was located within 37 feet of the plot marker.
 |
| Measuring distance from the plot center |
Why 37 feet? A circle with a radius of 37 feet (technically 37.2 feet) measures 1/10 of an acre. By measuring plots of this size we can easily estimate the number of trees found in the woods.
Why only measure trees with a DBH of 6 inches or greater? Trees of that size are large enough that they can be sawn into lumber. No, there are no plans to harvest any of the trees at Audubon Woods - I am just using this measure as a convenient reference point.
Once trees over 6 inches DBH had been identified, the students then found the distance of each tree from the center point, used a compass to find the azimuth (degree) of each tree from the center point, and used a Biltmore stick to measure diameter. A Biltmore stick is measuring device much like a ruler that is (among other features) calibrated to measure the diameter of a tree by holding it against the trunk and reading the numbers on the scale.
A Biltmore stick is used by holding it at arm's length against the tree trunk and lining left end of the stick with the left edge of the trunk. Then, without moving your head, read the number where the right edge of the trunk intersects the stick - this is your trunk diameter.
 |
| Measuring tree diameter with a Biltmore stick |
All of this data (degree, distance, and diameter of each tree) was then recorded on a data sheet. The distance and azimuth was used to plot the trees on a map.
 |
| Plotting tree azimuth and distance |
The students measured (and plotted) a total of 169 trees on their 15 one-tenth acre plots for an average of 11.27 trees per plot. The smallest number recorded in any plot was four trees (all very large) and the largest number was twenty-eight trees. If we multiply the average of 11.27 trees/one-tenth acre plot by ten we get the number of trees per acre as 112.7. Multiply that by the number of acres in the woods (forty) and we get an estimate for the number of marketable trees in the forest as 4508 trees. Previous classes have estimated the total number of trees (included any tree taller than six feet) as between 24,000 and 29,000 trees. I am fairly confident that these estimates are somewhat accurate.

 |
| Students working together to calculate canopy cover |
What sort of results did the students find in this activity? Many students reported as much as 100% canopy cover at their study sites. The lowest recorded canopy coverage was 36% on one plot. The majority of groups recorded canopy coverage between 65 and 95 percent.


A third project involved involved determining the number of leaves on the forest floor and the total weight of those leaves. This activity required the students to count the number of leaves in one square-foot plots at three random places in the woods. Each group was given a square made of PVC pipe to measure out their individual plots. These squares would be tossed randomly in the woods to ensure that students were not seeking places with few leaves or many leaves. Once a square was tossed the students would remove and count every leaf (or large leaf fragment) in the square.
 |
| Counting leaves in a one square-foot plot |
Once the students had counted the leaves in three different plots, they added those three numbers together and divided by three to find the average number of leaves in each square foot. This number was then multiplied by 43,560 to find the number of leaves in one acre and then multiplied again by forty to find the number of leaves on the entire floor of the forest. Estimates for the entire forest ranged from 162,565,920 leaves to 208,391,040 leaves. This calculates to an average of 179,554,320 leaves in the 40 acre forests; 4,488, 856 leaves per acre; or 103.05 leaver per square foot.


This data is interesting because I can compare it the date from previous years. For example in June 2015, students counted twice as many leaves per square foot (approx. 209 leaves). This translates to 9,094,880 leaves per acre or 363,795,218 leaves total in 40 acres. Why are there so many less leaves this year? I don't know, but if we continue to monitor this woods we may see a trend.
To measure the total weight of leaves, students counted out 100 random leaves and weighed them on a digital scale. The then divided that number by 100 to find the average weight per leaf (grams). This average was then multiplied by the total number of leaves that each group had estimated and then converted to kilograms by dividing by 1000. Average weights ranged from a low of 0.3488 grams/leaf to a high of 0.4688 grams/leaf. Estimates of total weight ranged from 58,343.9kg to 93,525.9kg.
We last did this activity in October 2015. Our estimates of the weight of all leaves on the forest floor then ranged from a low of 146,328.074 kilograms to a high 220,883.818 kilograms. This is more than double our estimates from this year. However, this data doesn't really show us anything because the fall leaves had a much higher moisture content than leaves that have fall from the tree and then sat on the ground decaying for six months.
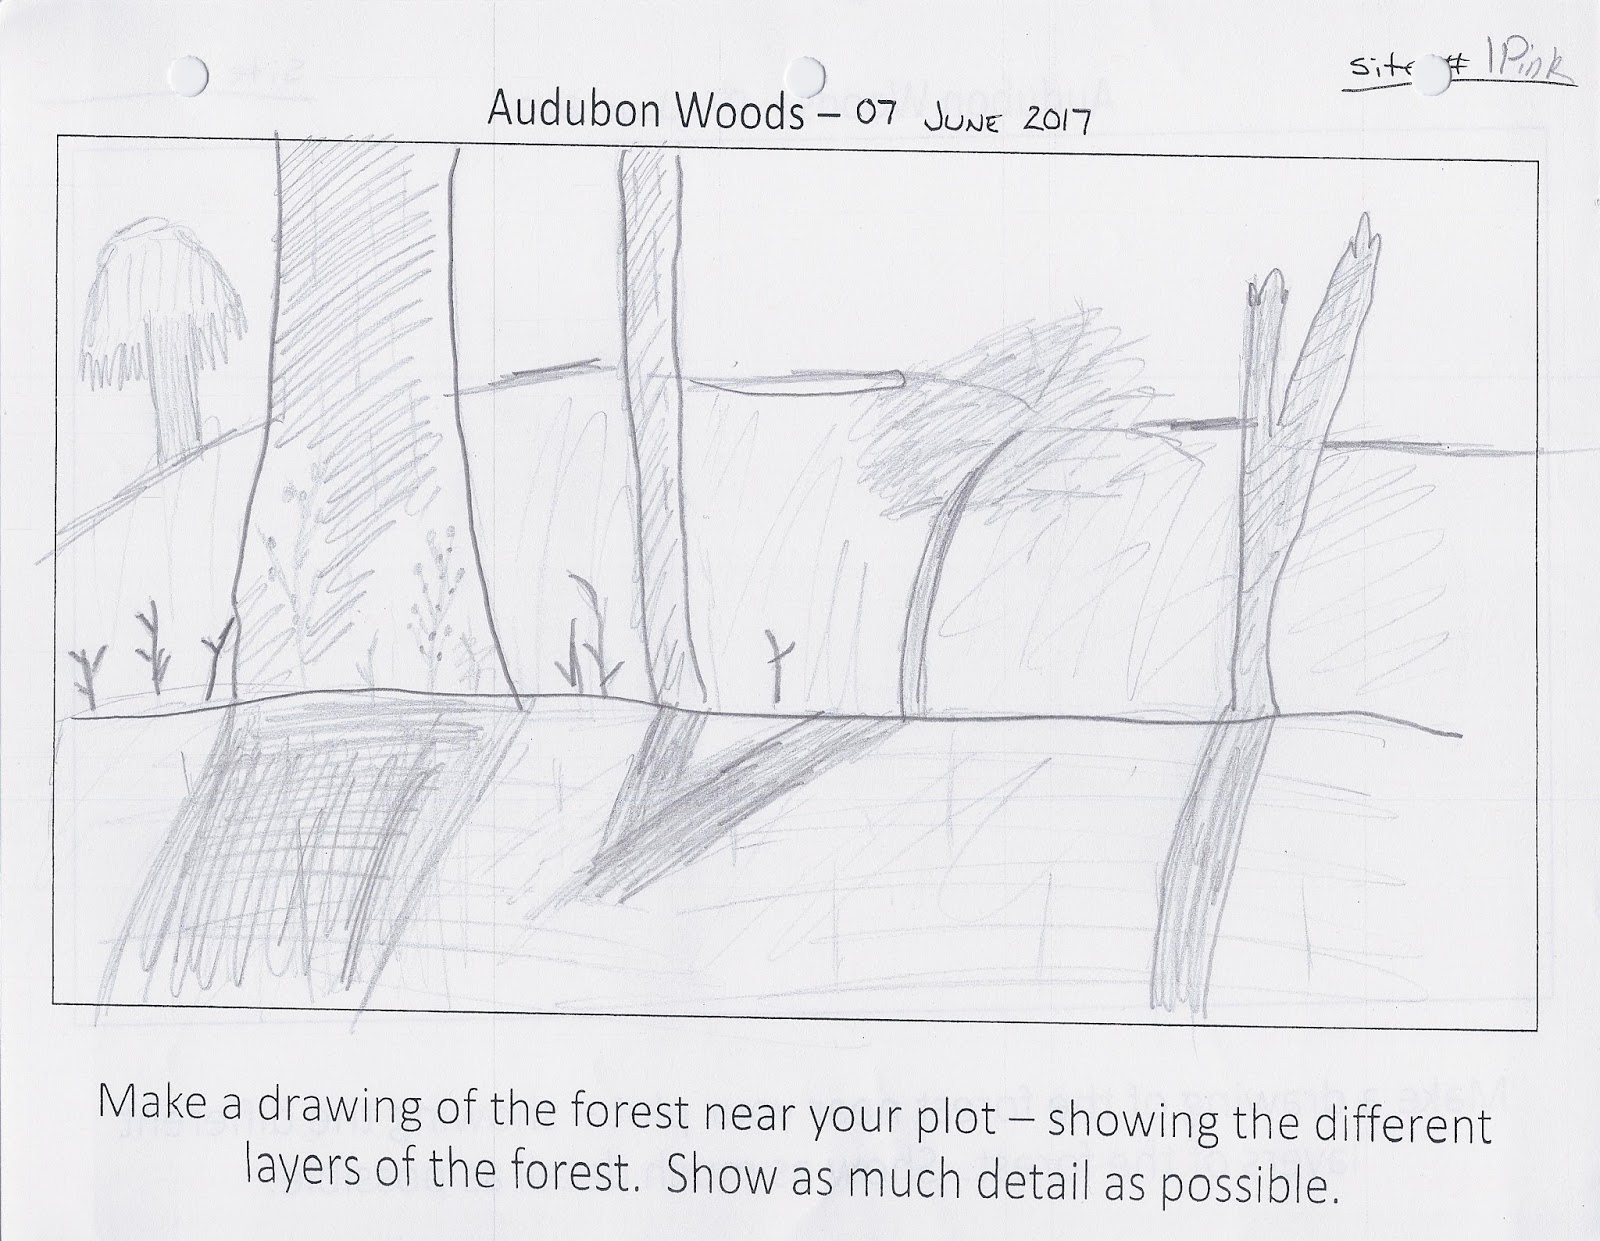
The final activity that I asked the students to complete was a sketch of their survey sites.


What did I learn from all of this. The students generally liked the activities and did very well on them. A couple of groups needed a little bit more direction than other, but all groups completed every activity that was asked of them. Some students expressed a desire for more adults to be available to help them, but I really wanted their work to be independent of adults. I realize that I might have asked a bit much from the students; I probably would have gotten more thorough results if students had only been required to work at two plots instead of three, but I was impressed by the amount of real science that these students were capable of doing in a relatively short time. All of the students wanted more time allotted to explore the woods. I think for the next school year we will do both a fall and a spring trip, with the fall being used to explain how to do each aspect of the study and do a limited version and the spring being used to complete the whole study.
Here are a few more pics...
 |
| Measuring to see if a tree is in their plot |
 |
| Figuring out diameter |


 |
| Counting leaves |
 |
| A view of the canopy |
 |
| Wood frog |
 |
| Jack-in-the-pulpit |
 |
| Ebony Jewelwing damselfly |

 |
| Squaw-root is a parasitic plant |
No comments:
Post a Comment